Goal of the project
The biggest drag wihle riding a roadbike is aerodynamic drag. In racing, the difference between winning and losing is often as small as the width of the tire. How to reduce the drag is a big problem. The cross sections of brake and shift wires are circular, which generate Karman vortices and create very large drag. The goal of this project is to reduce aerodynamic drag by covering the wires with a streamlined cover.
Result
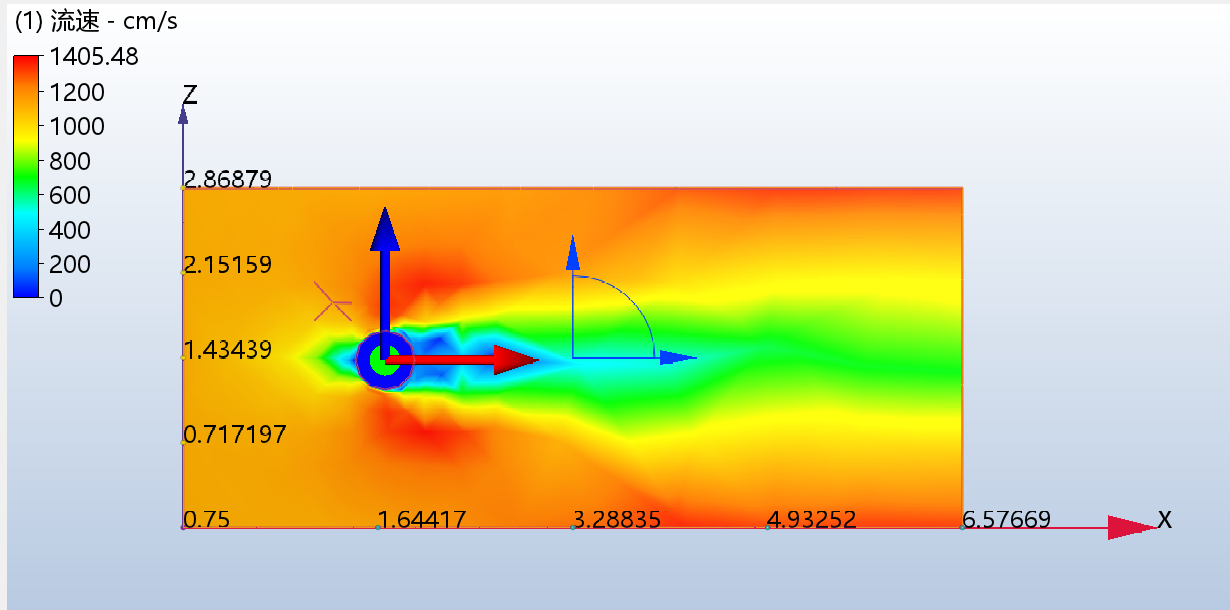
CFD from Autodesk was used for the simulation. The experimental values of the resistance coefficient of a cylinder are known in a literature (H.Schlichting; Boundary Layer Theory). A calculation model for the simulation which is the closest to the experimental values is adopted. The k-ω model often used in RANS has a disadvantage that it cannot predict detachment of fluid near a wall well. The SSTk-ω model is a hybrid of the k-ω model, which is good at near-wall calculations, and the k-ε model, which is good at far-from-the-wall calculations. Since the wheel manufacturer FLO had revealed that the angle of attack was ±20° during actual bicycle riding, I performed the simulation by changing the angle of attack to 0°, 10°, and 20°.
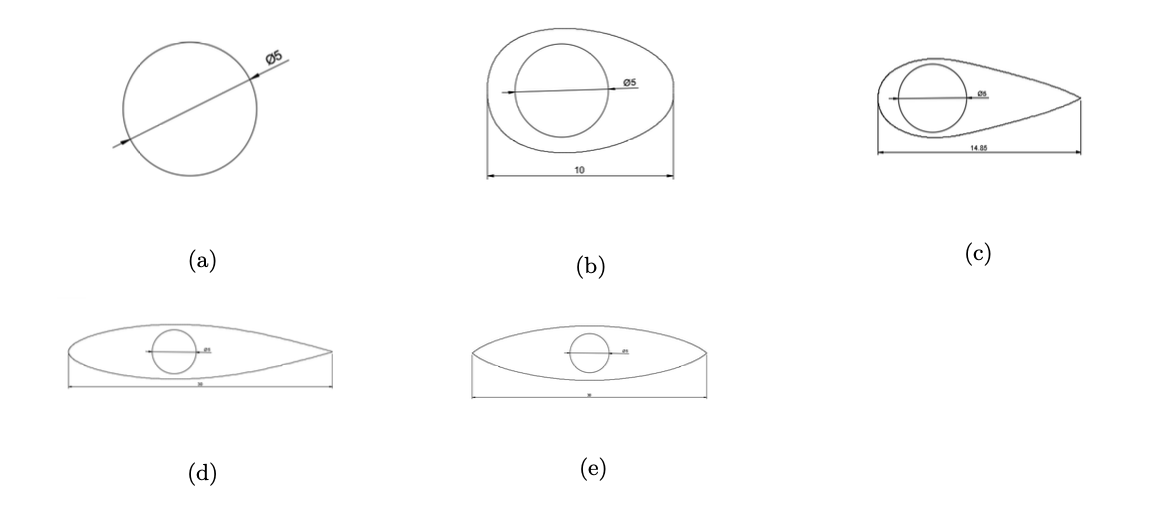
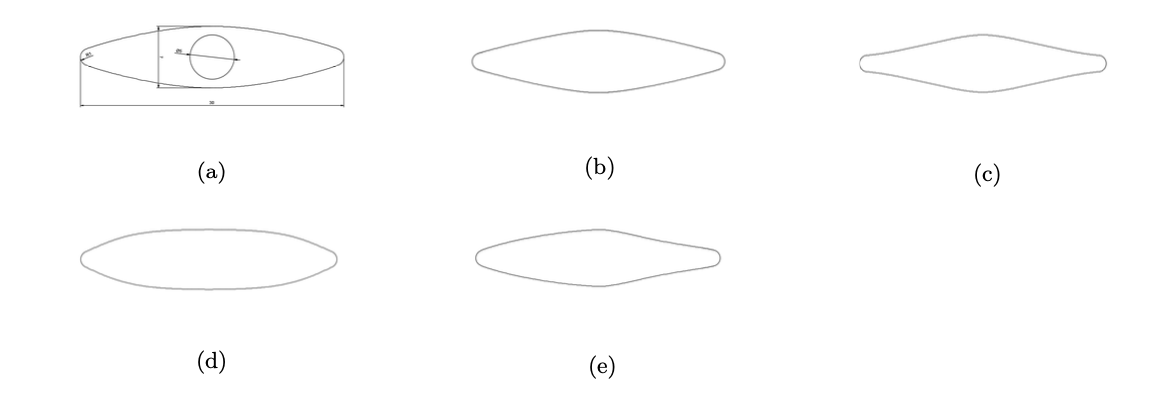
Among (a) to (e) in the above figure, the lens type (e) had the smallest aerodynamic drag. This is also shown in previous studies. Therefore, the simulation was newly performed with five kinds of cross-sections in the following figure.
The results are shown below.
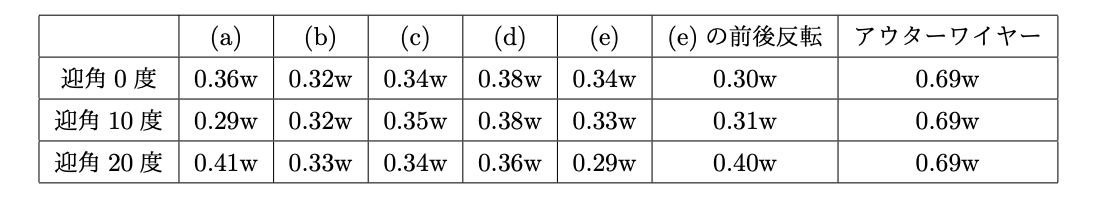
From the results, it was found that the raised center part has a drag reduction even for the whole range of angle of attack. However, in the reality, the wind often settles in the angle of attack of 10°, and shape (a) is the best for such a small angle of attack. The inverted model (e) also shows a great drag reduction at small angles of attack, but it is necessary to align the front and rear of the model correctly when actually installing the model. Considering the trend of drag reduction of these models, the accuracy of the holes in the fabrication, and the ease of installation, shape (a), which is a front-back symmetrical shape, was adopted.
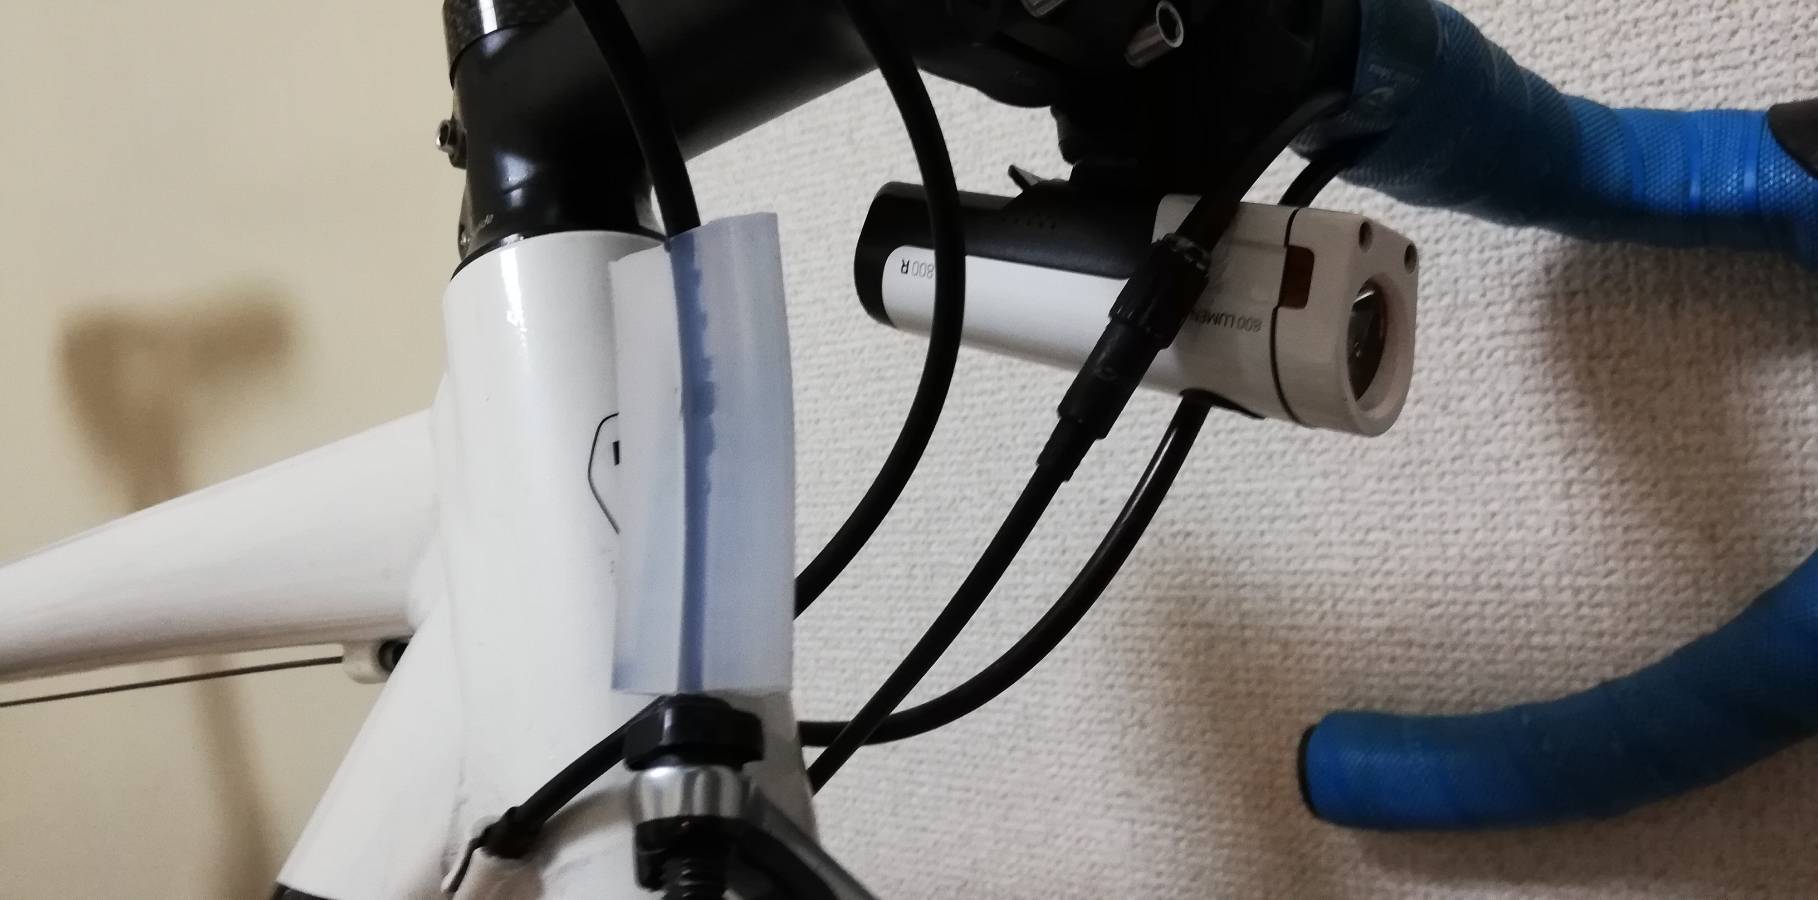
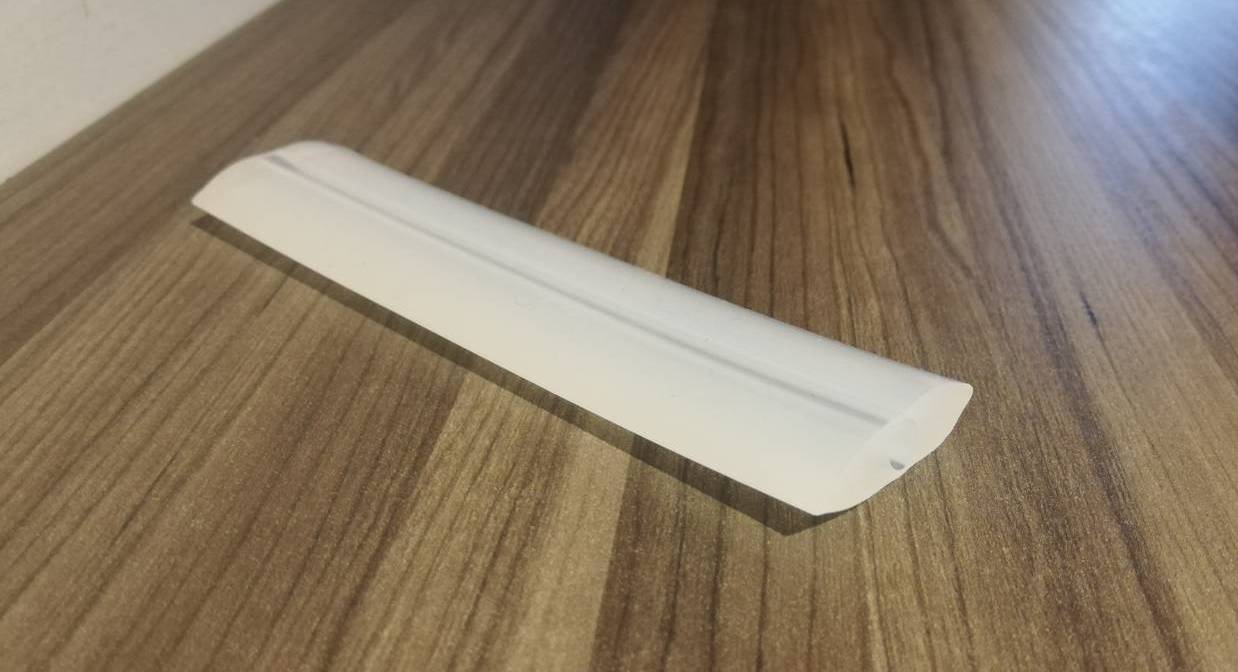
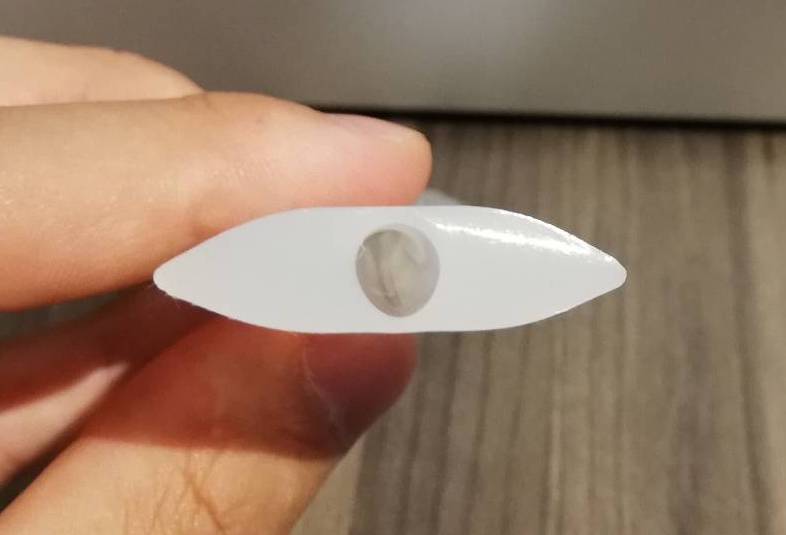
The cover was produced by extrusion process with silicon.
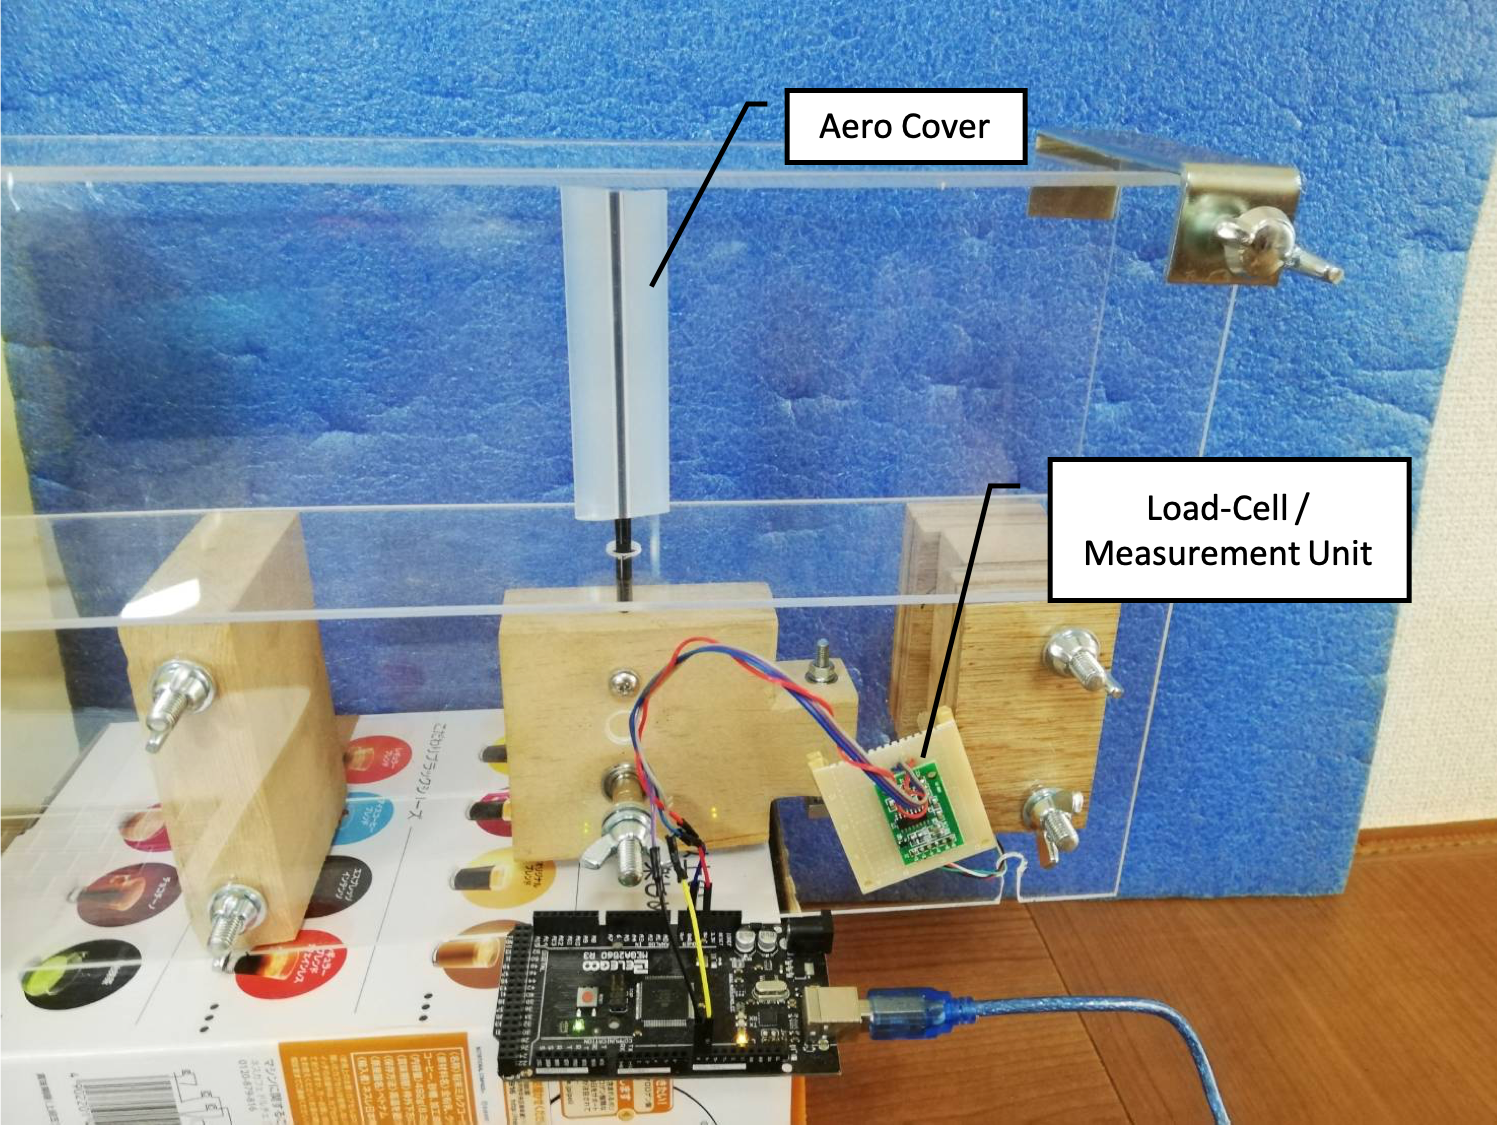
To verify the performance of the aero-cover, a wind tunnel was built and the cover was tested in it.
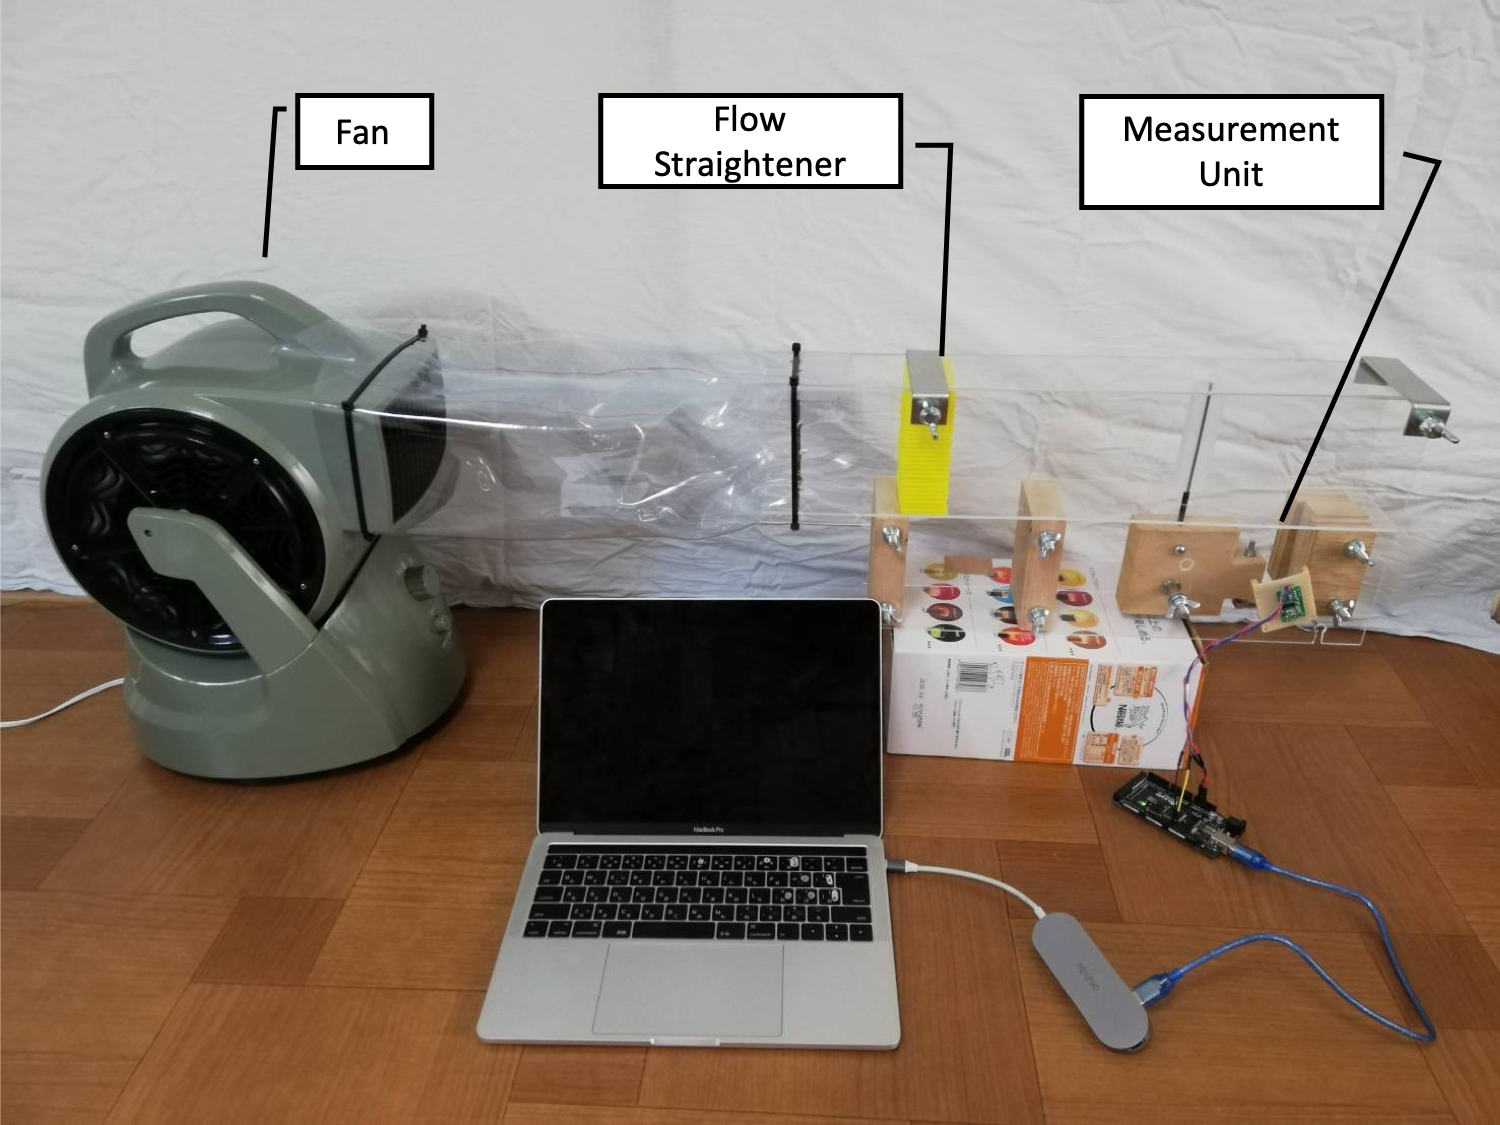
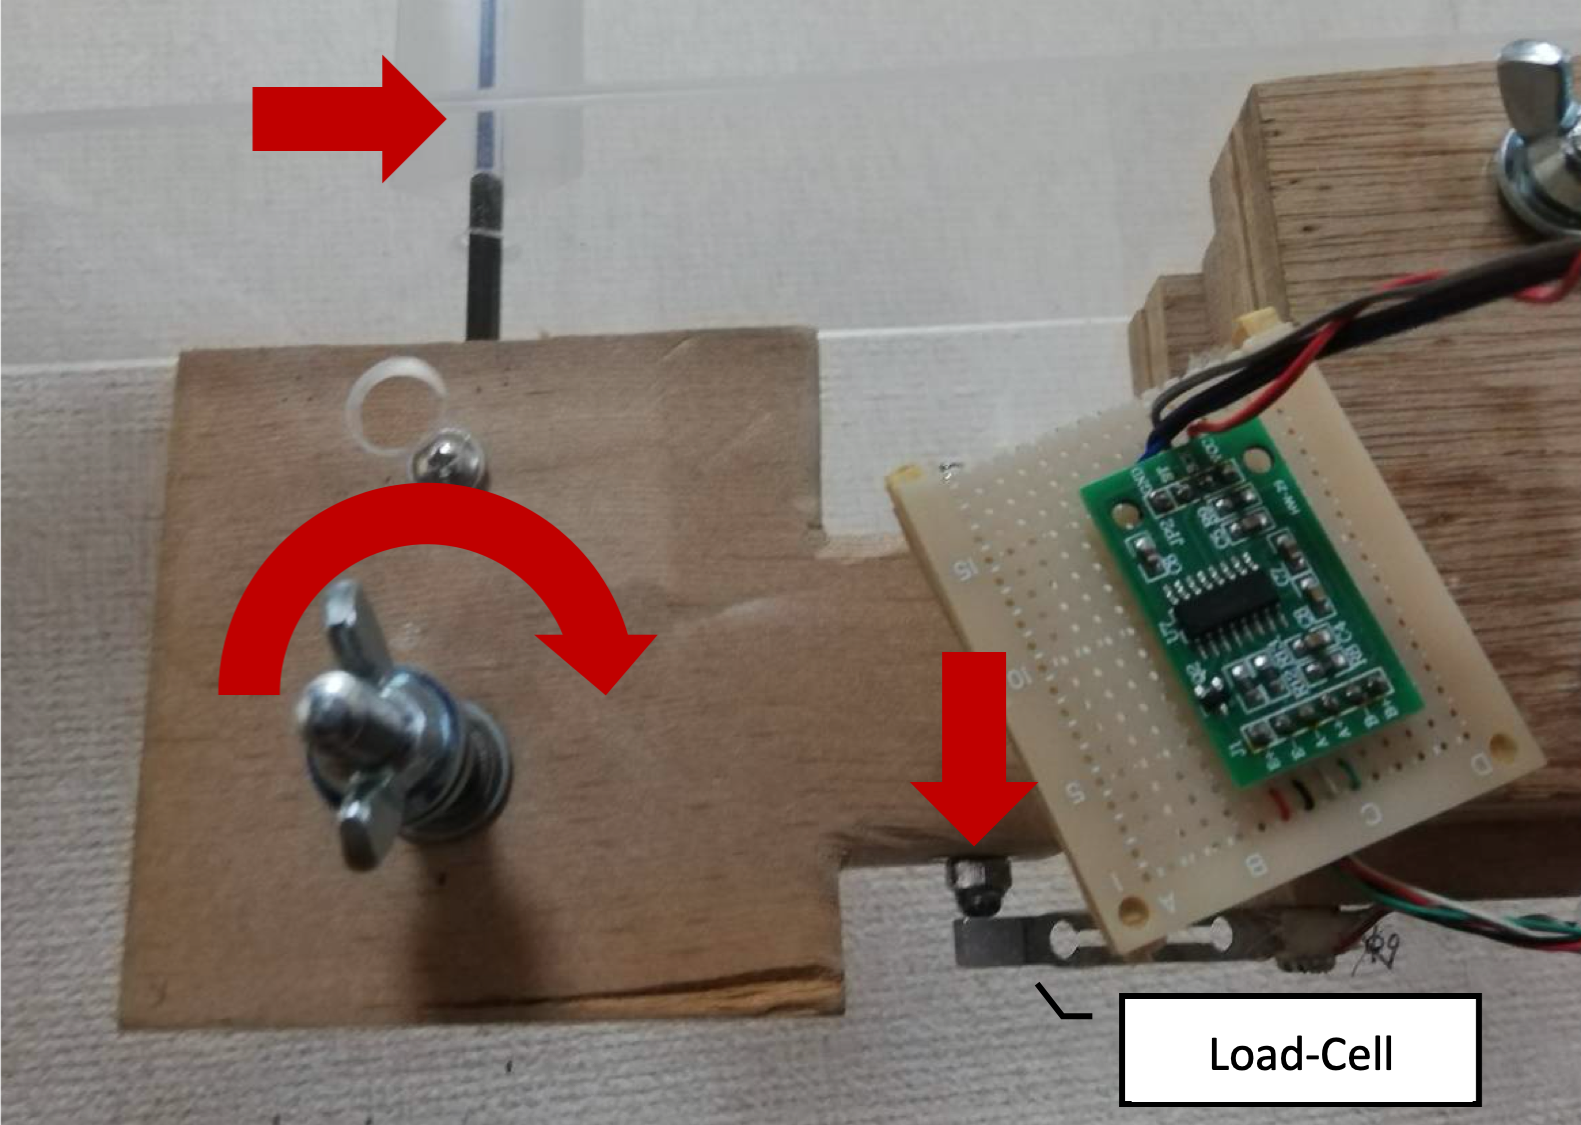
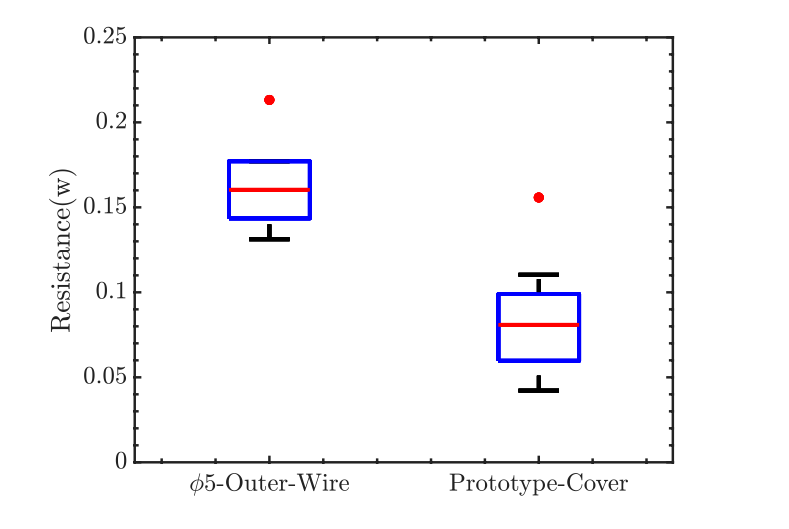
Measurements were taken at a wind speed of 8.2 m/s, which is the maximum wind speed in the wind tunnel. The measurement results are shown below. The box diagram shows the results. The red dots at the top show the results of the simulation performed at the same wind speed. The prototype model used in the simulation was reproduced by measuring the actual geometry. The results show that there is a similar difference between the box diagram and the simulation results for both the outer wire and its cover. This can be interpreted to be caused by the friction of the moving parts of the measurement unit. As mentioned earlier, the simulated values of the aerodynamic drag of the outer wire are consistent with the experimental values in the literature. It is possible to calibrate the values of the present experimental results on this basis. Considering the difference between the experimental and simulated values of the outer wire alone, the experimental results of the prototype are close to the value of that simulation. This result shows that the prototype has significantly reduced aerodynamic drag compared to the outer wire alone. If we can reproduce the shape (a) more precisely by devising the mold, we can reduce the aerodynamic drag even more.
This shows how it was mounted.